Software
Clustering
Last update: October 1st, 2019
Data analysis for flow cytometry has traditionally been done by manual gating on 2D plots to identify known cell populations. This technique presents some limitations, such us subjectivity, difficulties in detecting unknown cell populations and difficulties in reproducibility.
These problems are especially present in high-dimensional settings (large numbers of parameters per cell). To address these issues, partially or fully automated analysis methods have been developed.
Automated analysis methods can be classified into two categories: supervised and unsupervised(1).
Supervised automated analysis methods
This approach relies on an external variable, that can be biological or clinical, describing each sample. This external variable is used as an input to train a model and can then be used to predict the status of new samples.
Unsupervised automated analysis methods
Clustering methods are used to detect groups of cells with similar protein marker expression profiles.
This procedure allows previously unknown cell populations to be described in an unbiased manner; this exploratory analysis is impossible to perform with manual gating, especially with high-dimensional data.
Considering all this information, unsupervised approaches can be used to investigate the diversity of cell populations within a single sample; however; this kind of exploratory analysis is not possible with a supervised method(2).
There are several different clustering methods. For each method, there are input parameters in order to give the best possible performance. For many of them, the most important input parameters are related to the number of clusters. Some methods provide the number of clusters automatically, some methods allow to adjust the number indirectly through other parameters while others allow the user to directly include this number.
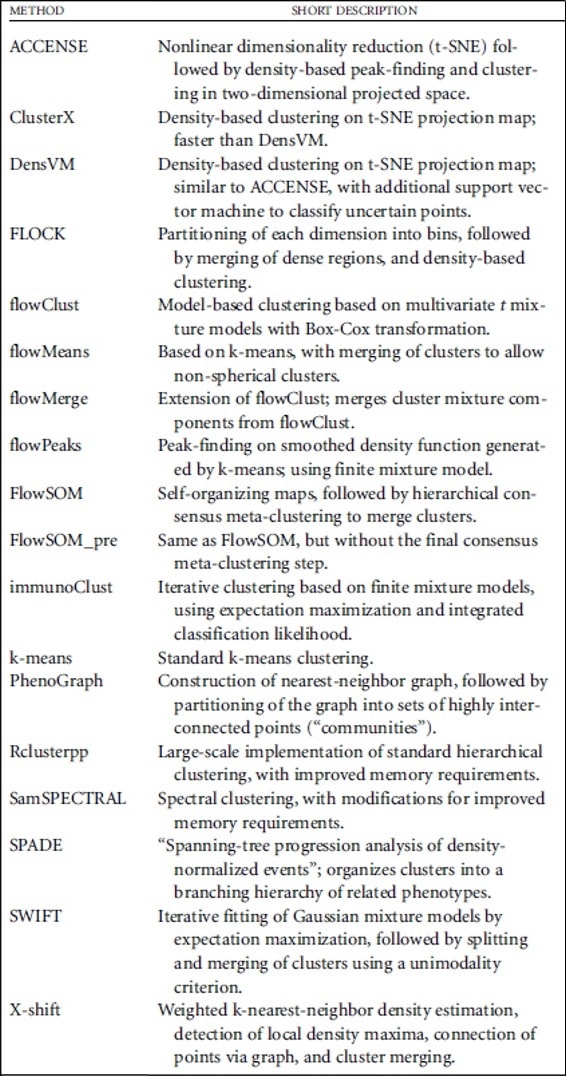
The different clustering methods are based on different theoretical approaches, which are described in Table 1.

Table 1. Clustering methods and description of the theoretical approaches for each method. Weber L M., Robinson M D., Comparison of Clustering Methods for High-Dimensional Single-Cell Flow and Mass Cytometry Data. Cytometry Part A. 2016.
Infinicyt™ Software includes a clustering tool based on a patented methodology:

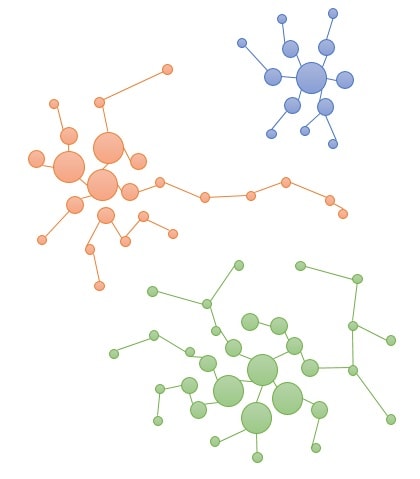
Phase 1: First the software calculates the density of all events. Then the algorithm links events with lower densities to the K-neighbor events until the algorithm cannot find a neighbor with higher density than the current event.
Iterative clustering of nearest events is performed until the next neighbor has a lower density than the current cluster.

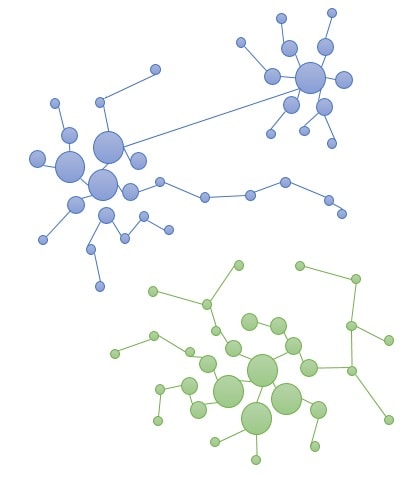
Phase 2: Creation of final clusters by merging initial clusters. Merging of clusters that have a common similarity above the selected similarity threshold.
See our videotutorial about Infinicyt™ Clustering tool to learn more about it:
Resources
Publications:
- Weber L M., (2016) Robinson M D., Comparison of Clustering Methods for High-Dimensional Single-Cell Flow and Mass Cytometry Data. Cytometry Part A. Go to publication
- Saeys Y, Van Gassen S, Lambrecht BN. (2016) Computational flow cytometry: Helping to make sense of high-dimensional immunology data. Nat Rev Immunol. 1:14. Go to publication

