
Acute leukemia: ALOT and BCP-ALL MRD Databases
Evaluation of samples with suspicion of acute leukemia (ALOT)
Some cases of acute leukemia are not easy to diagnose. Doubts arise due to the complexity of the disease, the variability of the immunophenotypic pattern, the variability in marker expression, and overlapping immunophenotypes. To address the complexity and subjectivity of multiparametric data analysis, EuroFlow™ has developed reference databases containing representative sets of flow cytometry data from both controls and patients for the most representative reagent panels like the ALOT (1, 2, 3).
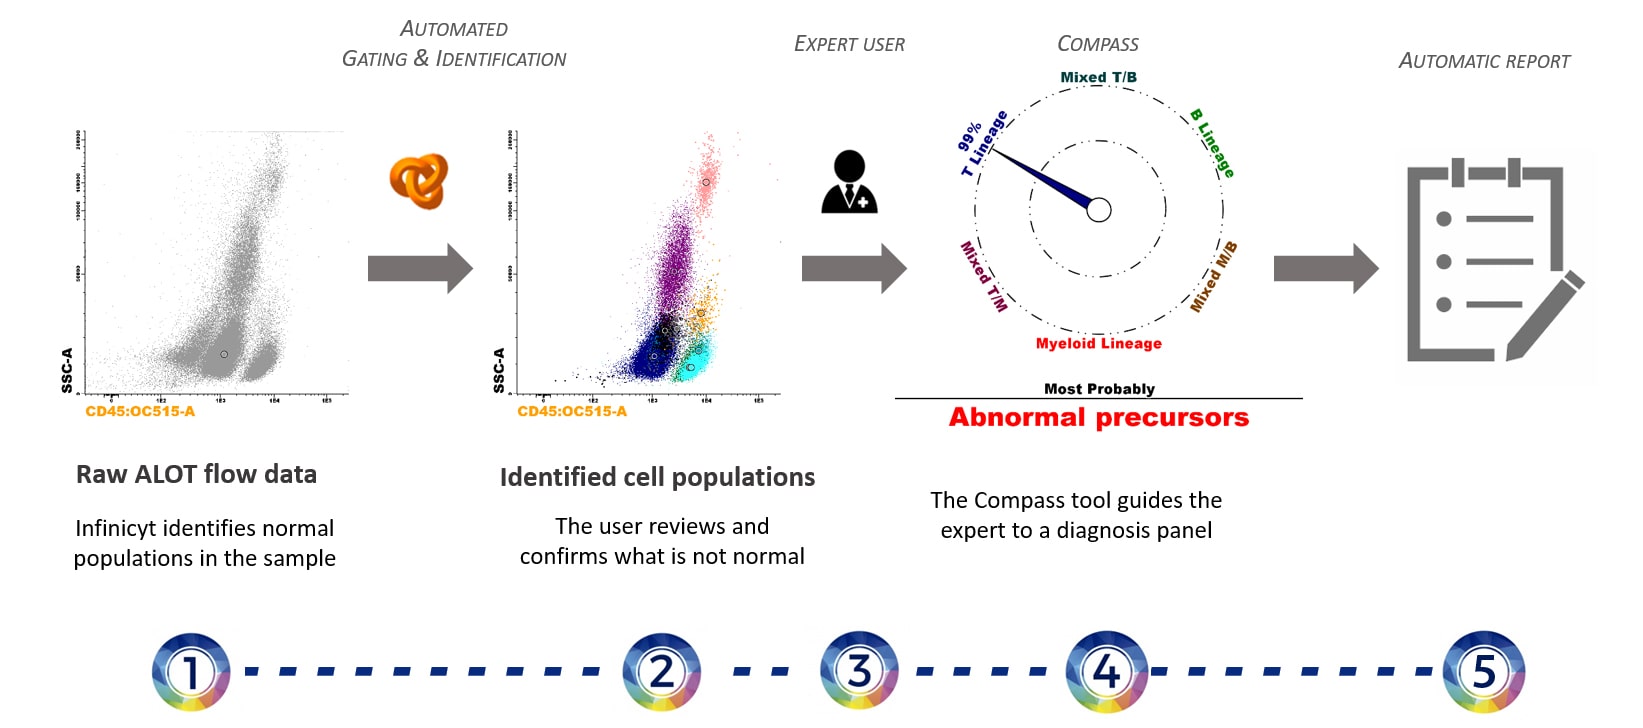
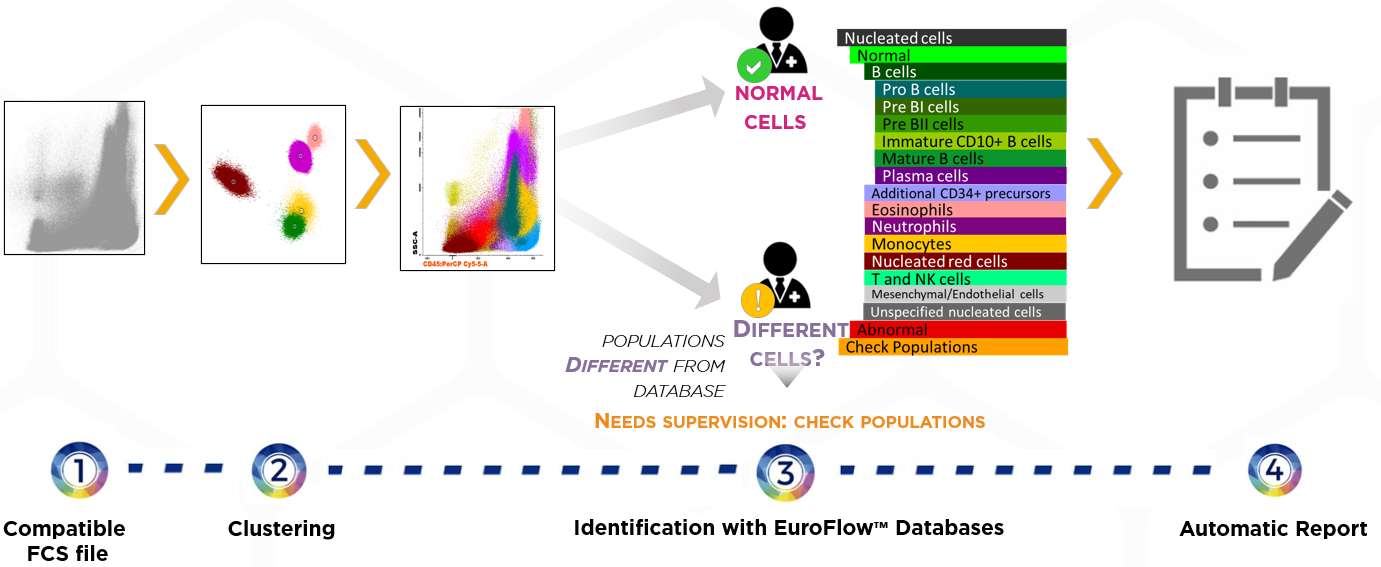
Overview of the general automated analysis process for ALOT samples including AG&I, Compass orientation and Automatic Report as described below:
- Compatible FCS file
Acquired using the EuroFlow™ SOPs for instrument set-up, sample preparation and antibody panel. - Clustering
All events are automatically identified by clustering algorithms. - Identification with EuroFlow™ Databases (AG&I)
Infinicyt™ automatically compares the clusters with the EuroFlow™ Database:
– Clusters identified as normal cell populations included in the database are directly renamed with the name of those populations.
– Clusters that are not identified as normal cell populations included in the database are assigned to Check Populations. The user has to review them and decide whether they are normal or abnormal. - Comparison of the abnormal population(s) identified with a reference database (Compass Classification Tool)
Once the abnormal blast population is identified, the software automatically performs a comparison (using the Compass tool) with a reference database containing abnormal (B, T and Myeloid) leukemic cells. - Automatic Report includes (click here to see an example):
– Frequency of each population with reference ranges.
– Relevant information on the analysis automatically updated for each sample.
– Available in 13 different languages.
1. Automated Gating and Identification (AG&I) (2)
Infinicyt™ Automated Gating and Identification tool provides a complete analysis of a given sample. For Acute Leukemia Orientation, two separate databases are used: one ALOT Database for peripheral blood samples and another ALOT Database for bone marrow samples. All cell populations present in the sample are compared with the normal reference database and classified either as normal, or as a Check Population that has to be reviewed by the expert. This, together with warnings and alarms related to the frequency of all sample populations, is meant to help the user when identifying the abnormal blast population.
How was the AG&I ALOT reference Database built?
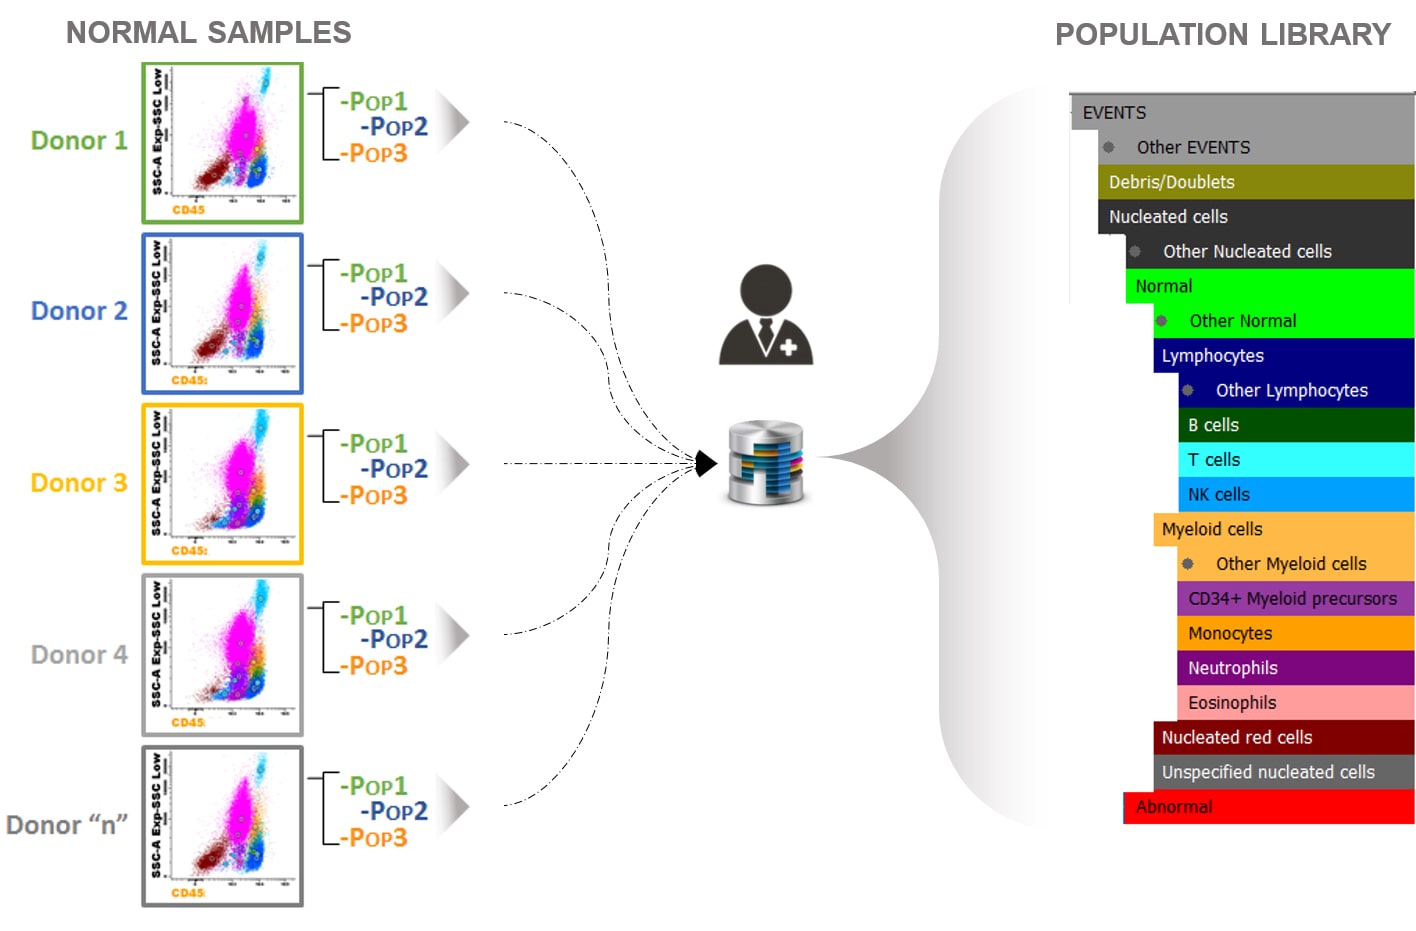
EuroFlow™ collected normal peripheral blood and bone marrow samples in different centers to reflect biological and technical variability regarding different laboratories, instruments and operators.
EuroFlow™ experts analyzed those normal samples and created a library of reference populations.
2. ALOT Classification Database (3)
Once the abnormal blast population is identified, the software automatically performs a comparison using the Infinicyt™ Compass tool, with a reference Classification Database containing abnormal (B, T and Myeloid) leukemic cells.
The ALOT classification Database is developed for the lineage assessment of the abnormal immature hematopoietic cells and proper characterization panel selection in samples suspected of acute leukemia. This database uses the Compass tool and compares the abnormal precursors with the database groups containing B-ALL, T-ALL and AML abnormal blast populations, independent of sample type (bone marrow or peripheral blood).
How was the ALOT Compass Classification Database built?
This database contains pathological cases collected at different EuroFlow™ centers and analyzed by flow cytometry experts. The building process started with 747 pathological cases of typical B, T and Myeloid acute Leukemia diseases. After a process of evaluation of EuroFlow™ standards each category was reduced in number of cases. Then, all these cases were merged and reviewed again to discard outliers to finally obtain the total cases that constitute the ALOT Database.

Schematic overview of the construction of the EuroFlow™ Database (2).
How to interpret the Compass results?

The following images represent different possible outcomes:
- Almost all events are similar to the cases from one group in the database.
- The selected events belong to two distinct lineages; part of the events are similar to the cases from one group in the database and part are similar to the cases from a second group in the database.
- Most of the events have a mixed phenotype between the groups indicated.
- Some of the events are similar to the cases from one group in the database and the rest have mixed phenotype/transitional potential.
MRD assessment in B-cell precursor acute lymphoblastic leukemia
Minimal residual disease detection for acute lymphoblastic leukaemia has proven to be a fundamental tool for guiding therapeutic decisions (4). The identification of MRD among million events implies high level of expertise and long time for data analysis and interpretation.
The EuroFlow™ BCP-ALL MRD Database improves accuracy and reproducibility of the results since the files are compared to a reference database. Numerical and immunophenotypic alerts highlight sample quality and processing, as well as populations that are out of range compared to normal reference data.
How was the BCP-ALL MRD Database built?
EuroFlow™ collected representative bone marrow samples from donors stained with the BCP-ALL MRD panel following the EuroFlow™ SOPs. The samples were collected in different centers to reflect biological and technical variability regarding different laboratories, instruments and operators. EuroFlow™ experts analyzed those normal samples and created a library of reference populations.
How to compare a new case with EuroFlow™ BCP-ALL MRD Database using Infinicyt™ Automated Gating & Identification tool?
- Compatible FCS file
Acquired using the EuroFlow™ SOPs for instrument set-up, sample preparation and antibody panel. - Clustering
All events are automatically identified by clustering algorithms. - Identification with EuroFlow™ Databases (AG&I)
Infinicyt™ automatically compares the clusters with the EuroFlow™ Database:
– Clusters identified as normal cell populations included in the database are directly renamed with the name of those populations.
– Clusters that are not identified as normal cell populations included in the database are assigned to Check Populations. The user has to review them and decide whether they are normal or abnormal. - Automatic Report includes:
– Frequency of each population with reference ranges.
– Relevant information on the analysis automatically updated for each sample.
Resources
Publications:
- van Dongen JJ, et al. EuroFlow antibody panels for standardized n-dimensional flow cytometric immunophenotyping of normal, reactive and malignant leukocytes. Leukemia. 2012 Sep; 26(9):1908-75. Go to publication.
- Lhermitte, L, et al. (2021). Automated identification of leukocyte subsets improves standardization of database-guided expert-supervised diagnostic orientation in acute leukemia: a EuroFlow study. Modern Pathology, 34(1), 59-69. Go to publication.
- Lhermitte L, et al. Automated database-guided expert-supervised orientation for immunophenotypic diagnosis and classification of acute leukemia. Leukemia. 2017 Apr; 2(4): 874-81. Go to publication.
- Contreras Yametti, G. P, et al. (2021). Minimal residual disease in acute lymphoblastic leukemia: current practice and future directions. Cancers, 13(8), 1847. Go to publication.