
Analysis
Infinicyt™ Software includes innovative tools for the analysis, integration and interpretation of flow data making the analysis multivariate, standard, efficient, sensitive and reproducible.
Diagrams and representations
Click image to zoom in ?
More than 30 high-resolution diagrams available.
Use dot plots and histograms to represent different parameters and populations in 2D and 3D.
Boxplots diagrams for the statistical comparison of parameters among different populations (within the same or different files).
Multidimensional plots allow the representation of an unlimited number of parameters in 2D and 3D.
Multidimensional analysis
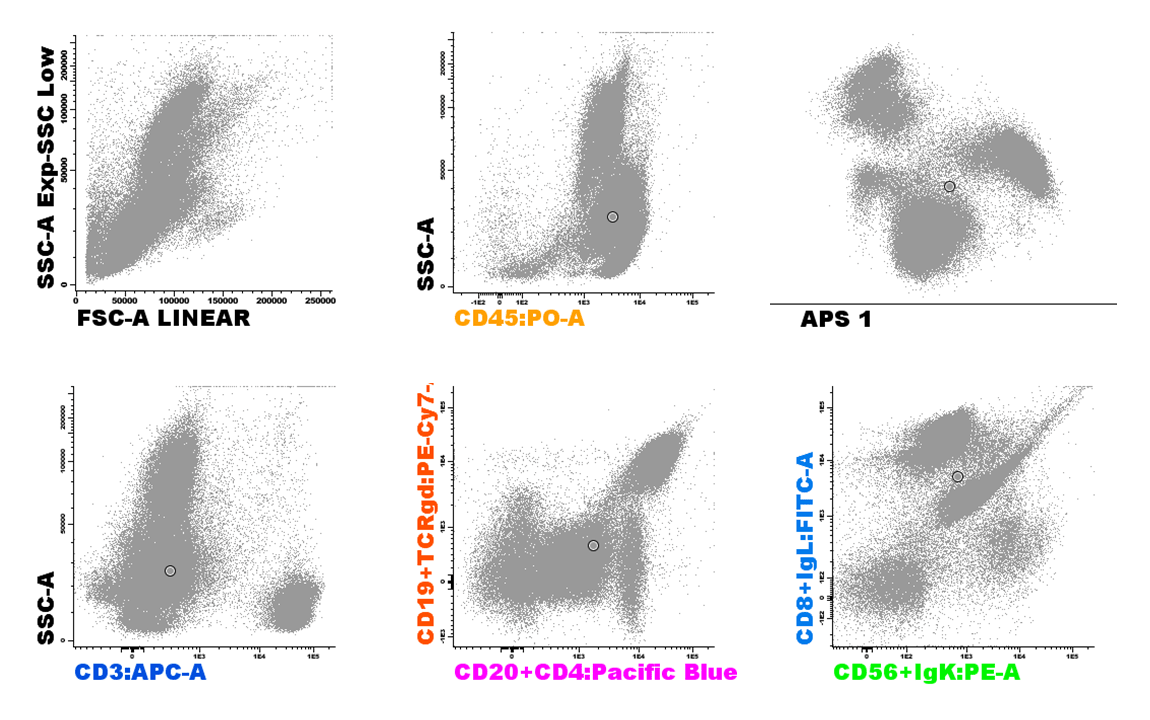
The Automatic Population Separator (APS), based on Principal Component Analysis, uses the information from all the parameters included in the file to provide the best cell cluster separation, and identifies the markers that are most significant for this separation.
The File Merge tool allows the integration of several files that can be analysed at the same time.
Click image to zoom in ?
Automated Gating and Identification and Automatic Report
Click image to zoom in ?
EuroFlow™ Databases – Analysis:
Automated identification of normal populations according to their similarity with the EuroFlow™ Databases, allowing a faster, reproducible and robust identification of abnormal cells.
EuroFlow™ Databases – Report:
Automatic Report with the numeric and phenotypic alterations found in the sample and referred to the normal reference ranges defined in the EuroFlow™ libraries. It also provides information about sample quality and relevant comments and conclusions for clinical routine.
Available in 13 languages (English, Spanish, Czech, German, French, Italian, Dutch, Portuguese, Romanian, Polish, Japanese, Chinese and Korean).
Learn more about EuroFlow Databases.
Save time with analysis templates
The Infinicyt™ profiles can save the following elements:
- Diagrams and their specific configuration (size, order, label configuration, data visualization, etc.)
- Population tree
- Report
- Reference Images
- Analysis Strategies
- Export Statistics configuration
- Stored Compensations
Additionally, Infinicyt™ 2.0 contains several profiles that are specifically prepared for some of the EuroFlow™ Tubes and Panels.
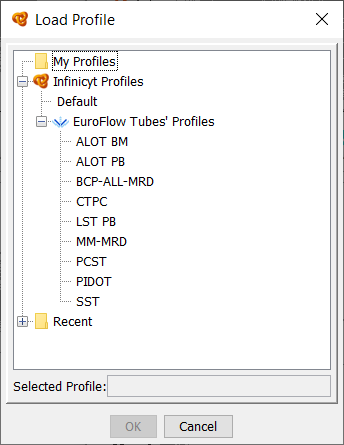
Click image to zoom in ?
Load several diagram workspaces for the analysis of different tubes (file merge) or for quality control purposes, all within the same profile.
Click image to zoom in ?
You can change the Analysis Desktop by selecting “Diagrams” > “Desktops”. In this example, “Analysis Desktop 1” is used for manual analysis of the MM MRD panel (2 tubes). “Analysis Desktop 2” is used for quality control of the acquisition, by displaying all parameters against “Time”. Acquisition issues are displayed at the end of both tubes because the acquisition ran out of sample before finishing and it was not stopped. All these events must be disregarded, so they are gated and assigned to “Debris & Doublets”.
Save your gating strategy to apply it to other samples.
Click image to zoom in ?
The analysis strategy can be applied and reviewed later to ensure that the cells in the current sample fall within the expected gates. Gates can be moved, resized, or drawn again in order to make the convenient adjustments.
Save immunophenotypic and numeric patterns from normal or abnormal populations and use them for comparison with future samples.
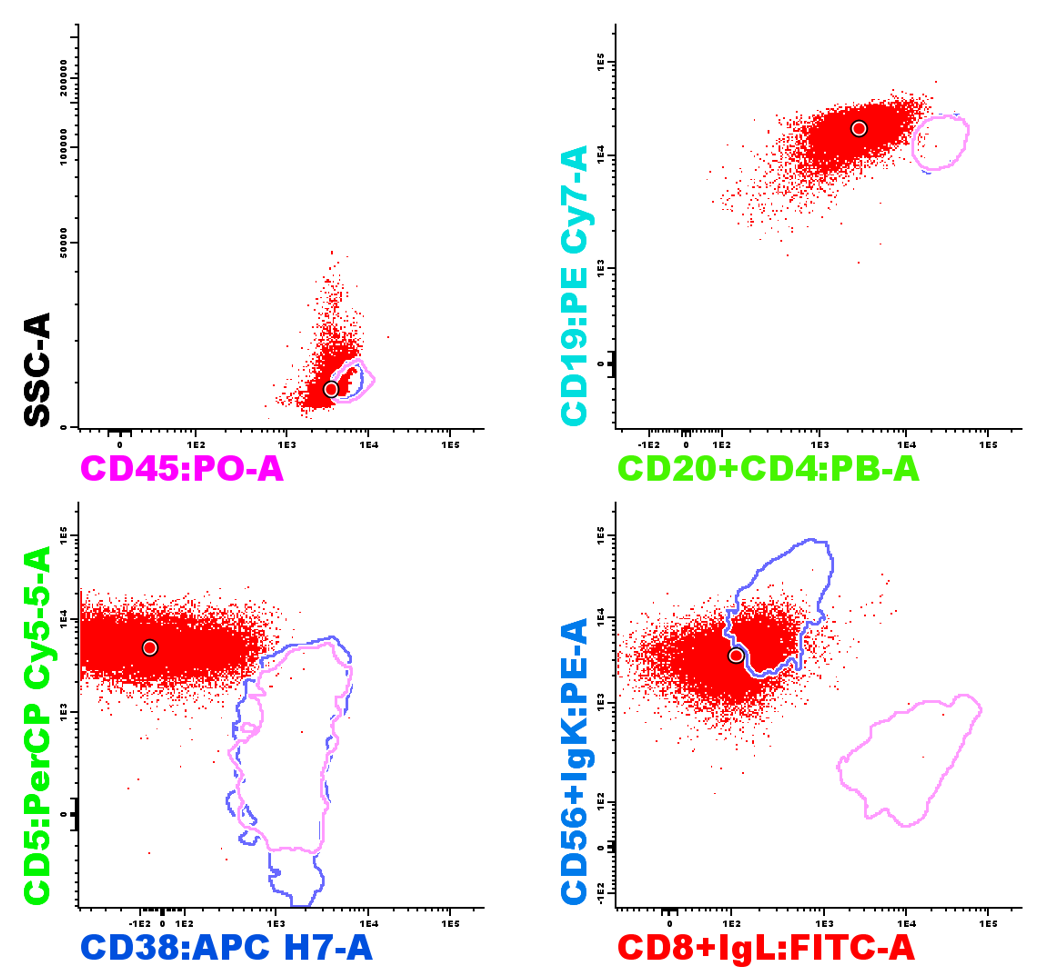
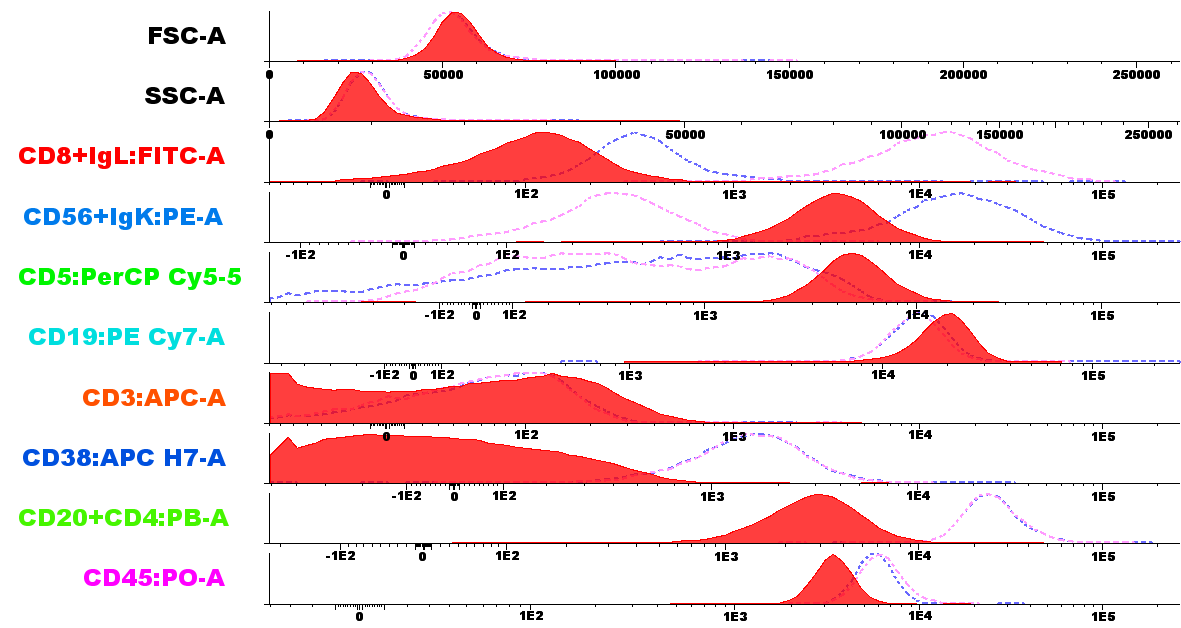
Click image to zoom in ?
Reference Images are displayed on the diagrams with dots or lines. For example, they can be displayed in Parameter Band Histograms to compare the immunophenotype of reference populations against the current sample. The diagrams above show an example of a Lymphoid Screening Tube analysis where abnormal B-cells (red dots) are being compared with reference (normal) Kappa and Lambda B-cells (purple and pink lines).
Advanced multidimensional tools and statistics
Obtain clusters of the events of a sample according to their immunophenotype in the multidimensional space. The clustering tool can be applied to any sample loaded in Infinicyt™.
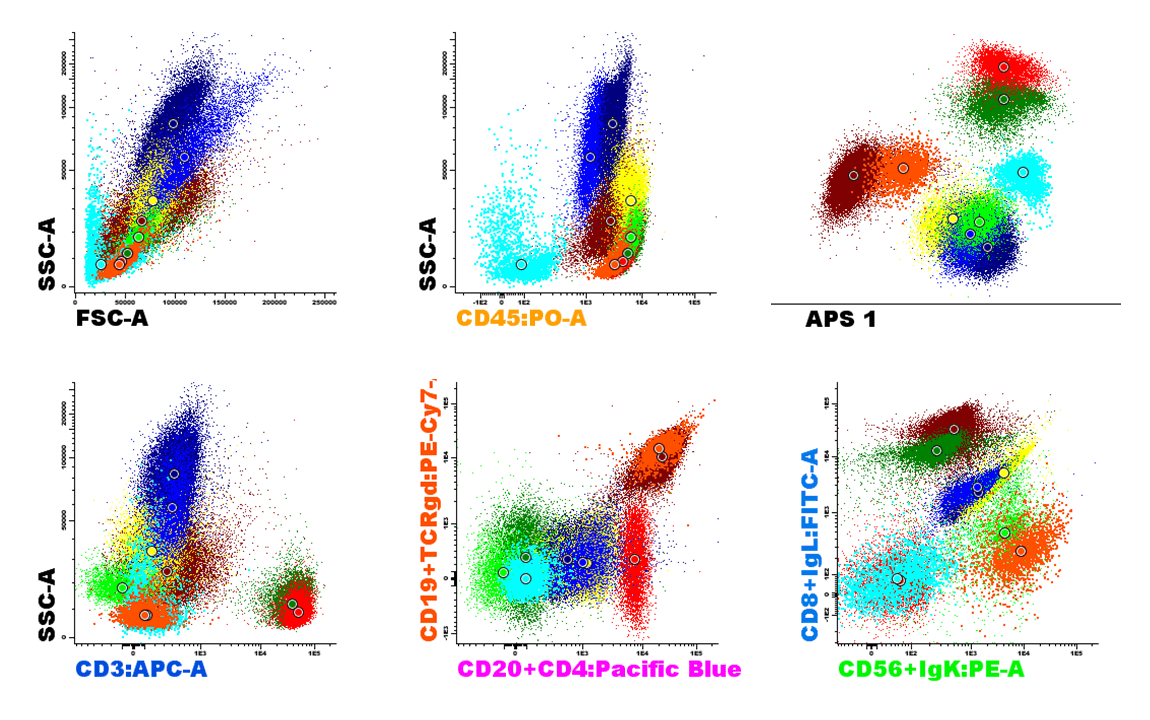
Click image to zoom in ?
Events are clustered into several populations because of their distinct immunophenotype. The clusters shown above have been automatically identified by the software without giving them a name (Cluster 1, Cluster 2, Cluster 3…). The user must review them after the clustering step and assign each cluster to the corresponding population: T cells, Kappa and Lambda B cells, NK cells, Neutrophils, Monocytes, Debris…
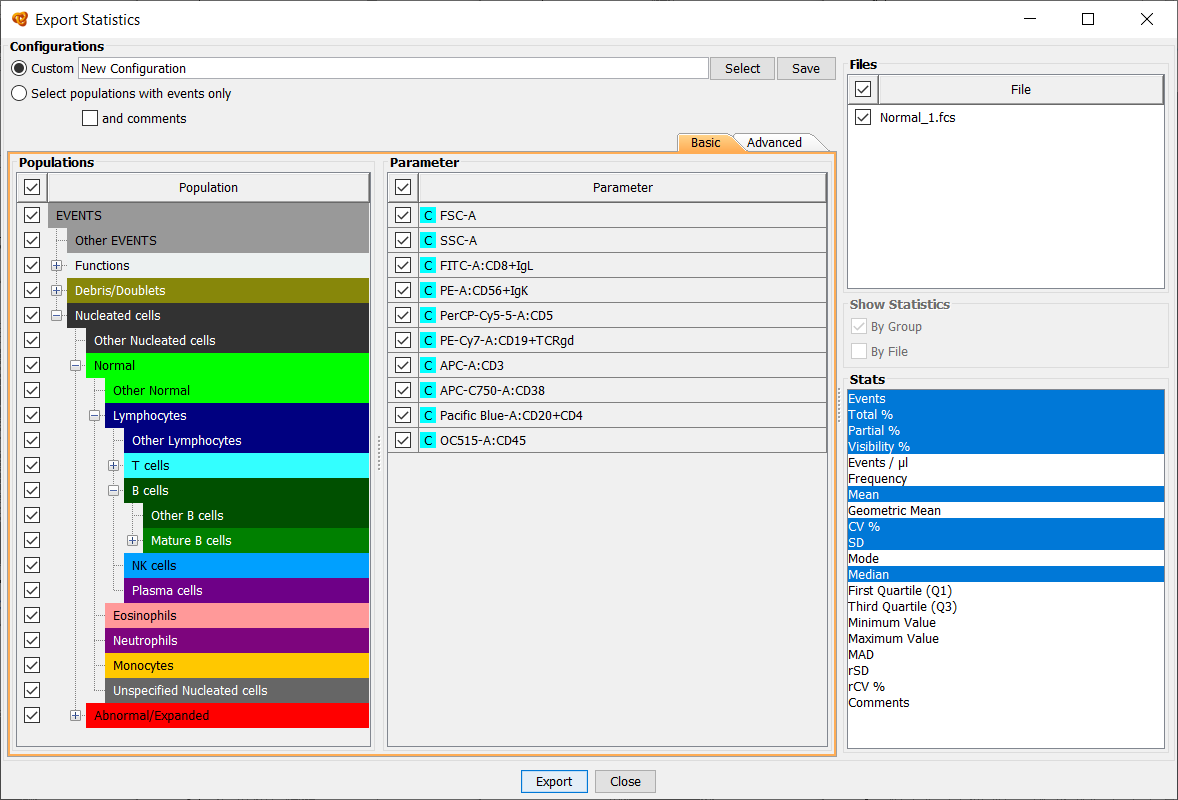
Obtain numerical information related to the number of events of each population and the parameters analysed. You can export statistics in Excel, .csv or .html format or copy them directly from Infinicyt™ to any spreadsheet.
Click image to zoom in ?
Get the percentage of positive events for each parameter based on a negative reference population.
Extrapolate non-measured parameter data in different tubes from the same panel.
Create your own databases and streamline the analysis
Create a database using your own pathological files and compare new samples with the database.
Assess the expression of multiple markers within different maturation stages and detect possible maturation blockades.
Create Maturation Databases including normal maturation patterns and compare new cases with the database.
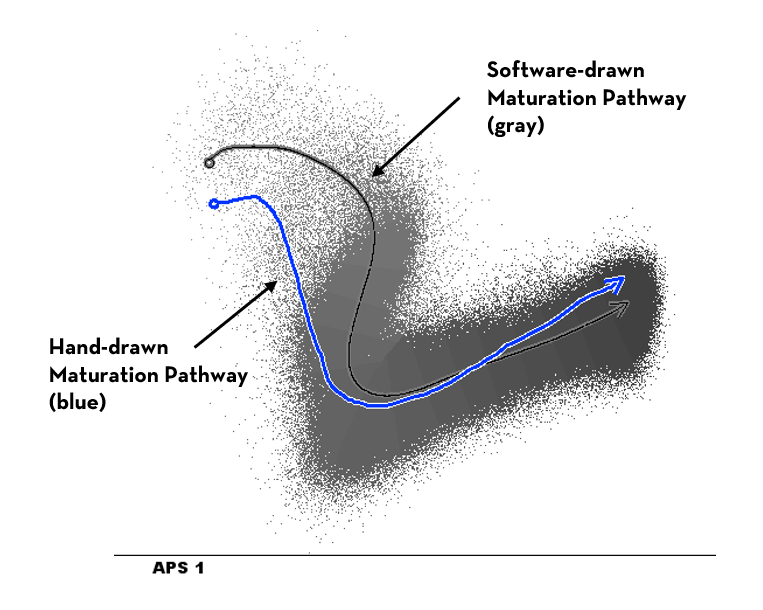
Click image to zoom in ?
The Maturation Pathway must be drawn free-handed from the early maturation stages to the final ones. It is automatically adjusted by the software taking into consideration the density of events surrounding this pathway.
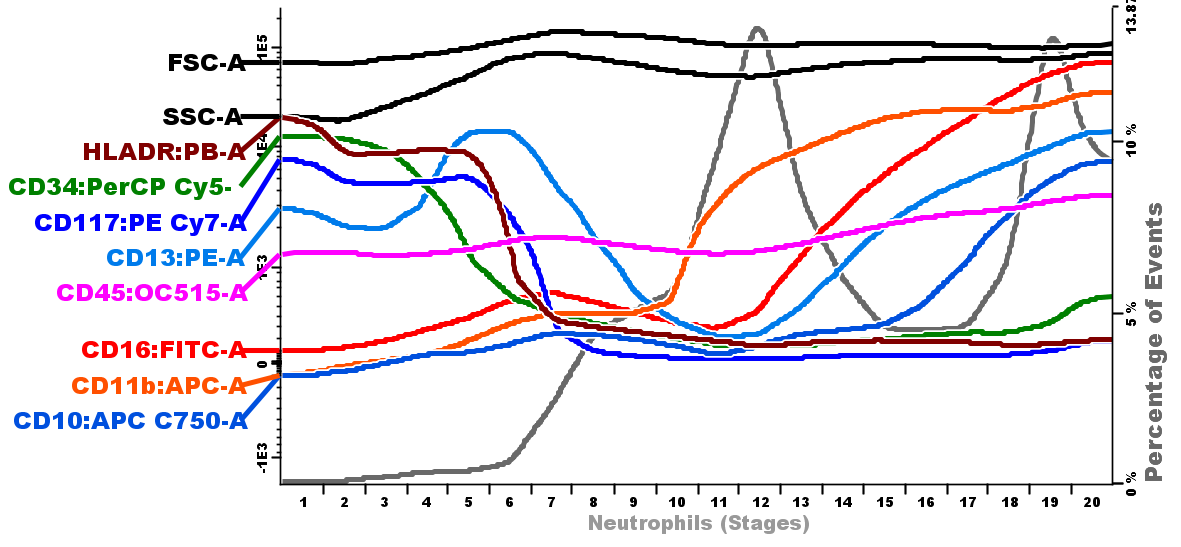
Click image to zoom in ?
The software divides the events into several population stages according to the adjusted pathway. The stages are displayed in the Population Tree and in the new Maturation diagram, which shows the median intensity fluorescence of each parameter and the percentage of events for every stage.
Configure different actions to be applied automatically to multiple files, such as:
- Loading an analysis strategy or a compensation matrix
- Configuration of the statistics or the report to be exported
- Comparison of files with the EuroFlow™ Databases
Use single stain controls to calculate the compensation matrix in Infinicyt™ and modify the compensation of your files as required, both manually or by loading a complete new matrix.